













// Data Analyst · Seattle, WA

Nahom Debela

Four years turning enterprise-scale data into dashboards and pipelines that hold up under real decisions — across energy utility, cloud commerce, and a $2B+ Azure business.

Portrait of Nahom Debela
400K+ records in one geospatial dataset modeled for reporting
$2B+ Azure Commercial business supported at Microsoft (via TCS)
50+ stakeholders using tools I built and shipped
30% reduction in pipeline maintenance cost after a cleanup I led

// About

Evidence before elegance.

I'm a data analyst who's spent four years on the unglamorous but decisive part of analytics: getting messy, high-volume data into a shape someone can actually act on. Most recently that meant building a wildfire-risk dashboard for a utility company — a 400K-record, 300-column geospatial dataset that had to survive real mitigation-planning decisions, not just look good in a demo.

Before that, four years at TCS on Microsoft's Azure Commercial Marketplace team taught me the other half of the job: what it takes to make a tool 50+ stakeholders actually rely on daily, and what it costs an organization when nobody owns the cleanup — which is why I also spent time auditing and killing 25+ dead pipelines that were quietly costing engineering time for nothing.

I care more about whether a number is right and reproducible than whether the chart is pretty. Power BI, SQL, and Python are the daily tools; Azure Data Factory, Databricks, and AWS S3 are where the data actually lives before it gets there.

SQL Python (Pandas) Power BI / DAX Azure Data Factory Databricks AWS S3 Geospatial Analytics Stakeholder UAT

// Work History

Two roles, one throughline: make the data trustworthy, then make it usable.

Nov 2025 – May 2026 · Seattle, WA

Senior Data Analyst

Logic 2020 — Client: Energy Utility

  • Designed and built a Power BI wildfire-risk dashboard and underlying data model, integrating a 400K+ record, 300+ column dataset to support multi-million-dollar mitigation planning decisions for a large utility company.
  • Used Python and pandas to ingest data from more than five sources — including wildfire, weather, and geospatial datasets — into AWS S3, performing EDA, transformation, and data-quality validation.
  • Led UAT walkthroughs with utility stakeholders, captured feedback, and iterated on the dashboard and data model, resulting in higher stakeholder satisfaction and fewer revision cycles.
  • Optimized the Power BI data model, relationships, DAX measures, and filters for high-cardinality geospatial data, improving dashboard responsiveness and performance.
  • Evaluated ArcGIS and Azure Maps when the original ~200K-polygon approach exceeded Power BI's mapping limits, then shifted to point-based visualization while preserving the client's ability to use the polygon file in their own GIS software.

Aug 2021 – Nov 2025 · Bellevue, WA

Analytics Engineer

Tata Consultancy Services — Client: Microsoft

  • Built and maintained 10+ SQL Server tables, views, and stored procedures supporting an Azure Marketplace business application and downstream Power BI reporting across a $2B+ Azure Commercial business.
  • Developed parameterized Azure Data Factory pipelines to ingest and transform data into Azure SQL, incorporating scheduling, validation, and error-handling logic for reliable downstream analytics.
  • Reduced pipeline maintenance costs by 30% by auditing and deprecating 25+ data pipelines across production environments, and led the migration of 40+ workflows to Azure Logic Apps with zero downtime.
  • Partnered with cross-functional stakeholders to translate business requirements into SQL-backed applications and Power BI solutions, leading UAT, documentation, and post-launch support for tools used by 50+ stakeholders.
  • Replaced two manually-produced daily reports with automated Power BI + Power Automate solutions using DAX, KQL, and Power Query, improving timeliness and consistency of stakeholder reporting.

// Selected Work

Real business problems, built end to end.

Every project below shipped to a real stakeholder — no toy datasets.

Geospatial Analytics Utility Risk Modeling

Power BI Wildfire-Risk Intelligence Dashboard

A wildfire-risk dashboard for a utility company's service territory, combining internal asset and geospatial data with public weather, FEMA, and wildfire datasets. Data science produced ignition-risk scores from a model I helped feed with validated source data; I owned the downstream transformation, Power BI data model, and delivery.

Techniques Used

  • Python (pandas) transformation of a 400K-record, 300+ column zone-level dataset for Power BI consumption
  • Derived reporting fields including ignition-risk-score buckets, split into zone- and feeder-level datasets
  • Power BI data model and DAX measures optimized for high-cardinality geospatial fields
  • Evaluated ArcGIS and Azure Maps after the original ~200K-polygon approach exceeded Power BI's mapping limits

Key Finding

The original requirement — visualizing ~200K zone polygons directly in Power BI — exceeded the platform's rendering limits. Shifting to point-based visualization (while handing the client the full polygon file for their own GIS software) preserved reporting speed without losing the underlying geospatial precision they needed elsewhere.

Power Platform ML Integration

Azure Marketplace Business Application

Microsoft's Azure Commercial Marketplace team was maintaining offer categories manually in Excel — products carried 1–5 loosely-defined keywords instead of one primary category, which quietly degraded reporting accuracy. Built a self-service application to fix it.

Techniques Used

  • Power Platform application with SQL Server backend for storage, querying, and transformation
  • Lookup tool with insert/update/delete, access restricted via managed security group, deep-linked to Power BI
  • Integrated a machine-learning-generated primary-category field once the data science team delivered it
  • UAT, approval workflow, email automation, usage documentation, and a recorded walkthrough for adoption

Key Finding

The application and its downstream Power BI reporting reached 50+ stakeholders, and the ML-generated category eliminated the manual entry that had been degrading reporting accuracy — turning a maintenance chore into a governed, self-service system.

Automation KPI Reporting

Automated Reporting Process — Microsoft 365 Marketing

Two reports were being rebuilt by hand every day: download from ICM and Power BI, transform in Excel, recreate the report. Slow, error-prone, and often stale by the time stakeholders saw it.

Techniques Used

  • DAX and KQL queries against Azure Analysis Services and Kusto, validated against the prior manual output
  • Power Automate to generate and email Excel reports on a daily schedule, replacing the manual rebuild
  • Two Power BI reports (DirectQuery + Import Mode) covering CTR, ROI, and campaign performance, with incremental refresh configured in the Power BI service

Key Finding

Beyond automating the rebuild, the new reporting surfaced a signal the manual process never had time to check: campaigns with high impressions but low click-through — a direct flag for creative that needed refreshing.

Platform Migration Risk Management

Power Platform → Azure Logic Apps Migration

A Power Platform environment was being deprecated after a reorg, putting dozens of business-critical workflows at risk — and some Power Automate actions had no direct Logic Apps equivalent, so the automation logic couldn't just be copied over.

Techniques Used

  • Evaluated three migration paths (new Power Platform environment, Azure Logic Apps, or rebuild in code) and presented the trade-offs to stakeholders
  • Manually recreated unsupported workflow logic for ~40 flows after Logic Apps was chosen
  • Tested each migrated flow individually and tracked status with daily updates through sprint meetings

Key Finding

Completed ahead of the deprecation deadline with zero downtime and no service interruptions — the riskiest part of the project (unsupported actions with no direct equivalent) was solved case-by-case rather than assumed away.

Data Governance Cost Reduction

ADF Production Pipeline Deprecation & Cleanup

An Azure Data Factory environment at Microsoft had accumulated unused and failing pipelines over years — quiet cost and maintenance drag with no clear owner for cleanup.

Techniques Used

  • Compiled a full pipeline inventory, traced each one to its owning team, and reviewed run history
  • Gave owners a one-month notice window to confirm whether a pipeline was still required before removal
  • Validated safe removal with stakeholders, then deprecated 25+ unused or failing pipelines across three production environments

Key Finding

Reduced pipeline maintenance costs by 30% — proof that a systematic audit-and-notify process can safely remove technical debt in a live production environment without breaking anything, and without just deleting first and asking later.

Azure Data Factory Ongoing Personal Project

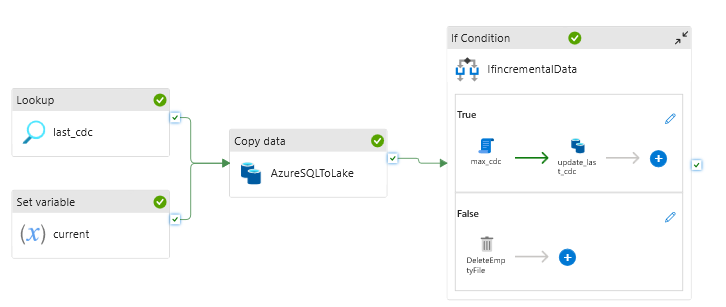
Spotify Incremental ADF Pipeline

A self-directed project to sharpen production-grade ADF engineering skills: a reusable, parameterized incremental-ingestion pipeline for Spotify-themed data, built the way a real production pipeline should be — not a one-off full reload.

Techniques Used

  • Metadata-driven ForEach pattern across five entities (DimUser, DimTrack, DimDate, DimArtist, FactStream)
  • Incremental loading from Azure SQL Database to ADLS Gen2 Bronze in Parquet, using entity-specific CDC fields and a persisted checkpoint
  • Branching logic that only advances the CDC watermark on non-empty loads — empty loads are cleaned up without falsely advancing the checkpoint
  • Optional backfill parameter for manual historical loads alongside normal incremental runs

Key Finding

One parameterized pipeline pattern now covers five entities without duplicated logic — the ingestion layer is designed as a reusable foundation for the transformation and analytics work still to come.

// On My Own Time

What I build when nobody's asking.

Automation Personal Finance

Personal Investing Dashboard & Trading Agent

A self-built system for tracking and researching my own investment portfolio — built because I wanted the same rigor I bring to enterprise dashboards applied to my own decision-making, not because I trust a black box to trade for me.

What It Does

  • Integrates with a brokerage API to pull live position and market data
  • Notion-backed watchlist and trade log for structured, reviewable research notes
  • An "AI Analyst" feature that summarizes market data and surfaces research questions, not trade decisions
  • Scheduled automation that checks positions and watchlist criteria on a recurring basis, with all trade decisions reviewed by me before execution
Nahom Debela hiking with a mountain view in the background

Outside of dashboards — Pacific Northwest hiking.

// Toolkit

The mechanics behind the work.

Querying & Languages

  • SQL
  • Python (Pandas, NumPy)
  • DAX
  • KQL
  • M (Power Query)

Visualization & Reporting

  • Power BI (data modeling, DAX, star schema)
  • Advanced Excel (XLOOKUP, pivot tables)
  • Dashboard Development
  • KPI Reporting

Data Engineering

  • Azure Data Factory (ETL/ELT, incremental loading)
  • Databricks
  • Azure SQL Database, ADLS Gen2
  • AWS S3

Delivery & Governance

  • Stakeholder Management & UAT
  • Requirements Gathering
  • Technical Documentation
  • Agile/Scrum

// Education & Certifications

B.S. in Data Analytics, Minor in Business Administration

Washington State University · 2019–2021

Databricks Data Engineer Associate

Certified · September 2025

Microsoft Certified: Fabric Data Engineer Associate

Expected · October 2026

// Get In Touch

Let's talk about your data.

Open to Senior Data Analyst, Analytics Engineer, and BI Engineer roles — Greater Seattle or remote.